1
2
3
4
5
6
7
8
9
10
11
12
13
14
15
16
17
18
19
20
21
22
23
24
25
26
27
28
| \usepackage{tikz}
\usetikzlibrary{bayesnet}
\begin{figure}[!ht]
\centering
\begin{tikzpicture}[scale=1.0,transform shape,
state/.style={circle,draw,thick,loop above,inner sep=0,minimum width=10}]
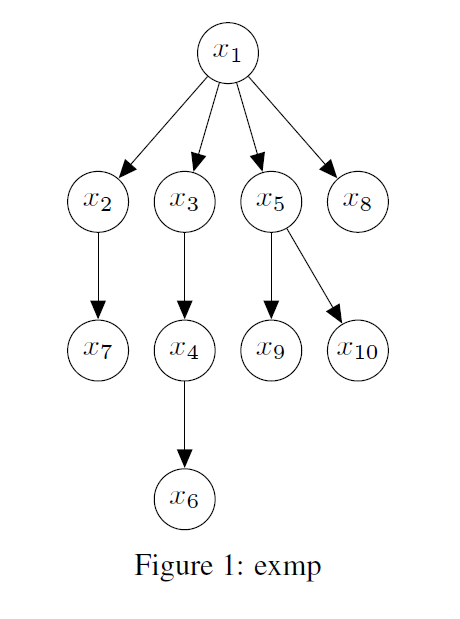
\node[latent] (x1) {$x_{1}$};
\node[latent, below=of x1, xshift=-1.5cm] (x2) {$x_{2}$};
\node[latent, below=of x1, xshift=-0.5cm] (x3) {$x_{3}$};
\node[latent, below=of x1, xshift=0.5cm] (x5) {$x_{5}$};
\node[latent, below=of x1, xshift=1.5cm] (x8) {$x_{8}$};
\edge {x1}{x2, x3, x5, x8};
\node[latent, below=of x2] (x7) {$x_{7}$};
\node[latent, below=of x3] (x4) {$x_{4}$};
\node[latent, below=of x5] (x9) {$x_{9}$};
\node[latent, below=of x8] (x10) {$x_{10}$};
\edge {x2}{x7};
\edge {x3}{x4};
\edge {x5}{x9, x10};
\node[latent, below=of x4] (x6) {$x_{6}$};
\edge {x4}{x6};
\end{tikzpicture}
\caption{exmp}
\label{fig:exmp}
\end{figure}
|


